The Thor Weather Scenario Server (named after Thor, the Norse god of thunder) is a data server that is part of an overall weather-data delivery architecture. This architecture was developed at Ames to provide simulated, realistic weather data to cockpit and ground display systems to facilitate research regarding the presentation and use of weather information.
Future work on the Thor project includes expanding the offerings of the type of weather products that can be included in a weather scenario. Additionally, a 3D interactive weather scenario editor is planned that will allow a researcher to tailor and even synthesize weather conditions to suite a particular experiment scenario.
Weather Scenario Generator
The Weather Scenario Generator processes the weather data in the archive to produce a weather scenario. It is a stand-alone application that provides tools for searching the archive for particular weather conditions, visualizing the weather, and performing some simple transforms on the weather. The transforms include region clipping, and geographic translation and rotation. The primary job of the scenario generator is to convert the weather data from its native format (each product, RUC, NEXRAD, etc., has a different storage format) into a common, easily processed format, referencable in latitude, longitude and altitude for utilization by Ames' advanced 3D displays. For example: NEXRAD data, a collection of range/value pairs along an azimuth, is converted to a set of polygons, each representing the region of value at a particular flight level. Once the data is converted, it is written to disk as a set of files comprising the weather scenario. Complete documentation is available to allow any application to read the weather scenario files directly, or they can accept weather data through use of the Thor Weather Server.
Thor Weather Scenario Server
The Thor Weather Server has the job of delivering the weather data in a weather scenario to any and all users of the data. Thor is message-based and listens at a well-known port for client connections. Client applications send a "subscribe" message to Thor, indicating interest in a particular weather product: wind, NEXRAD, visibility, etc. Thor acts as a sequencer: the weather data in a scenario is time-correlated, but may have differing update rates. For example, winds change every hour, whereas NEXRAD data changes every six minutes (nominally). When Thor receives a message to start the scenario, it starts keeping track of the weather products in the current scenario. When a weather product has an update (for NEXRAD, for example, at time zero and then every six minutes thereafter), Thor sends a notification message to each subscriber on that product. Upon receipt of the notification, a client may send a request for the data to Thor. Thor will send the weather data to the client in a reply message. A client may use Thor as a full data server, as merely a sequencer, or not at all, depending on its requirements. Documents describing the Thor server and its message catalog are available for download on this site.
Together, the Data Collection Subsystem, the Weather Scenario Generator and the Thor Weather Scenario Server constitute a complete architecture for delivering real-world, time-varying weather to flight deck, ground ATC, and other applications, in support of research into the integration of weather and traffic information. |
|
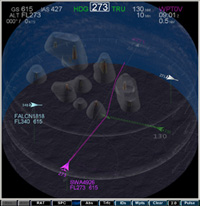
The image above is a photograph of a monitor displaying the three-dimensional CDTI. The reddish blobs represents areas of convective weather.
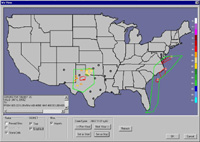
Scenario Generator Interface - Click for larger image (81.7 Kb)
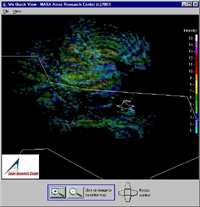
NEXRAD base reflectivity in a 3-D projection click for larger image (58.2 Kb) |